Hi, Arturs,
happy to see you here! I have good news for you regarding the questions asked:
1) You have the ability to attach multiple repositories to one project.
Go to Settings → Code Quality → Repositories. There you may add as much repositories as you want, to your project as well as different branches of a single repository.
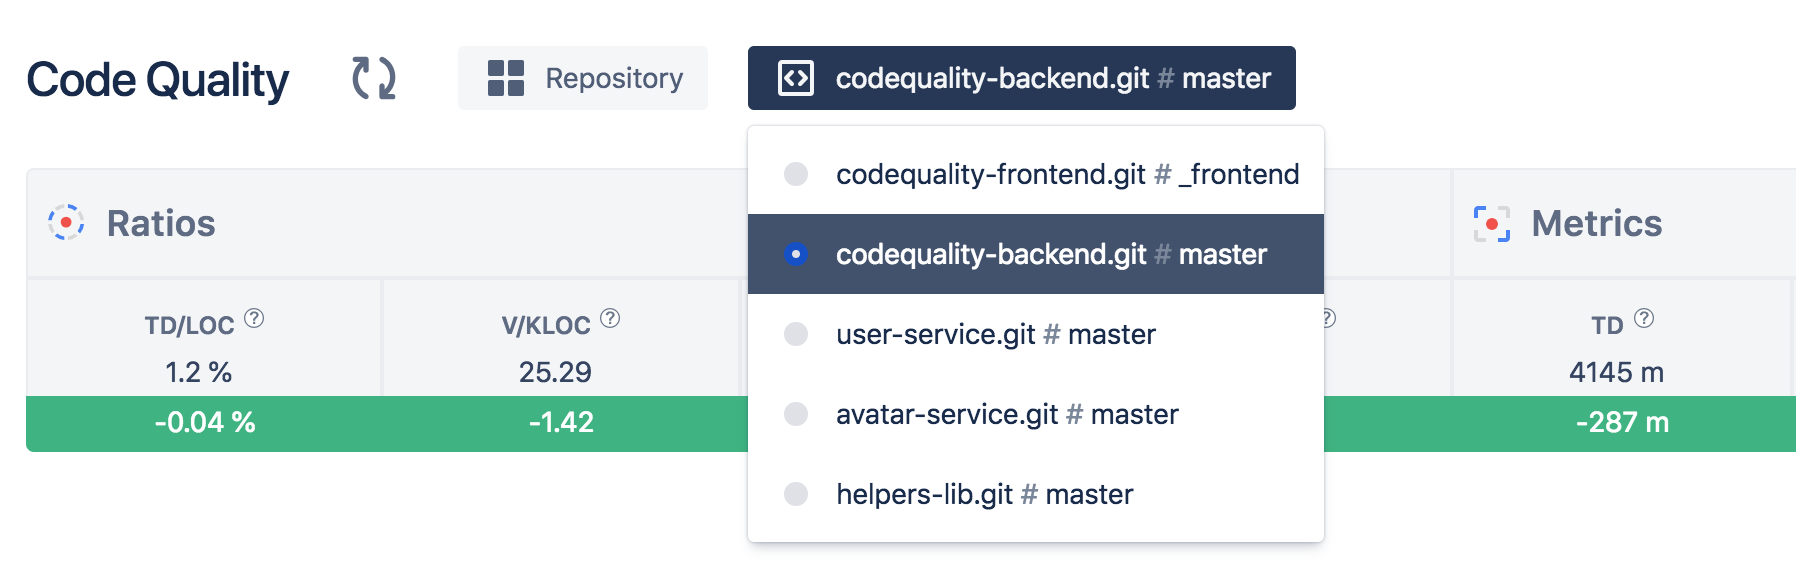
Then you can go from one repository to another, inside a project. There is a repository selector at the header. Here is how it looks like:
2) Project scale lets you see the combined data for all repositories included in the project.
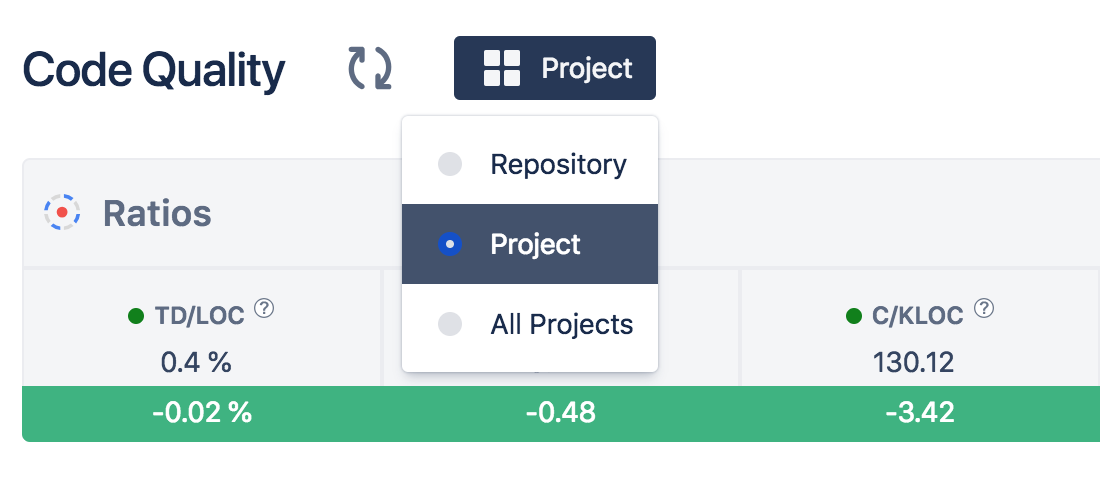
In the above-mentioned example we have several repositories attached to one project. Now to see the data combined, 2 clicks required on Data Scale selector that’s in the header, as well:
- By selecting Project - you get the data from all repositories attached to the project, combined.
- You can go further and combine the data for all repositories attached to your Jira instance. Select All Projects to do so.
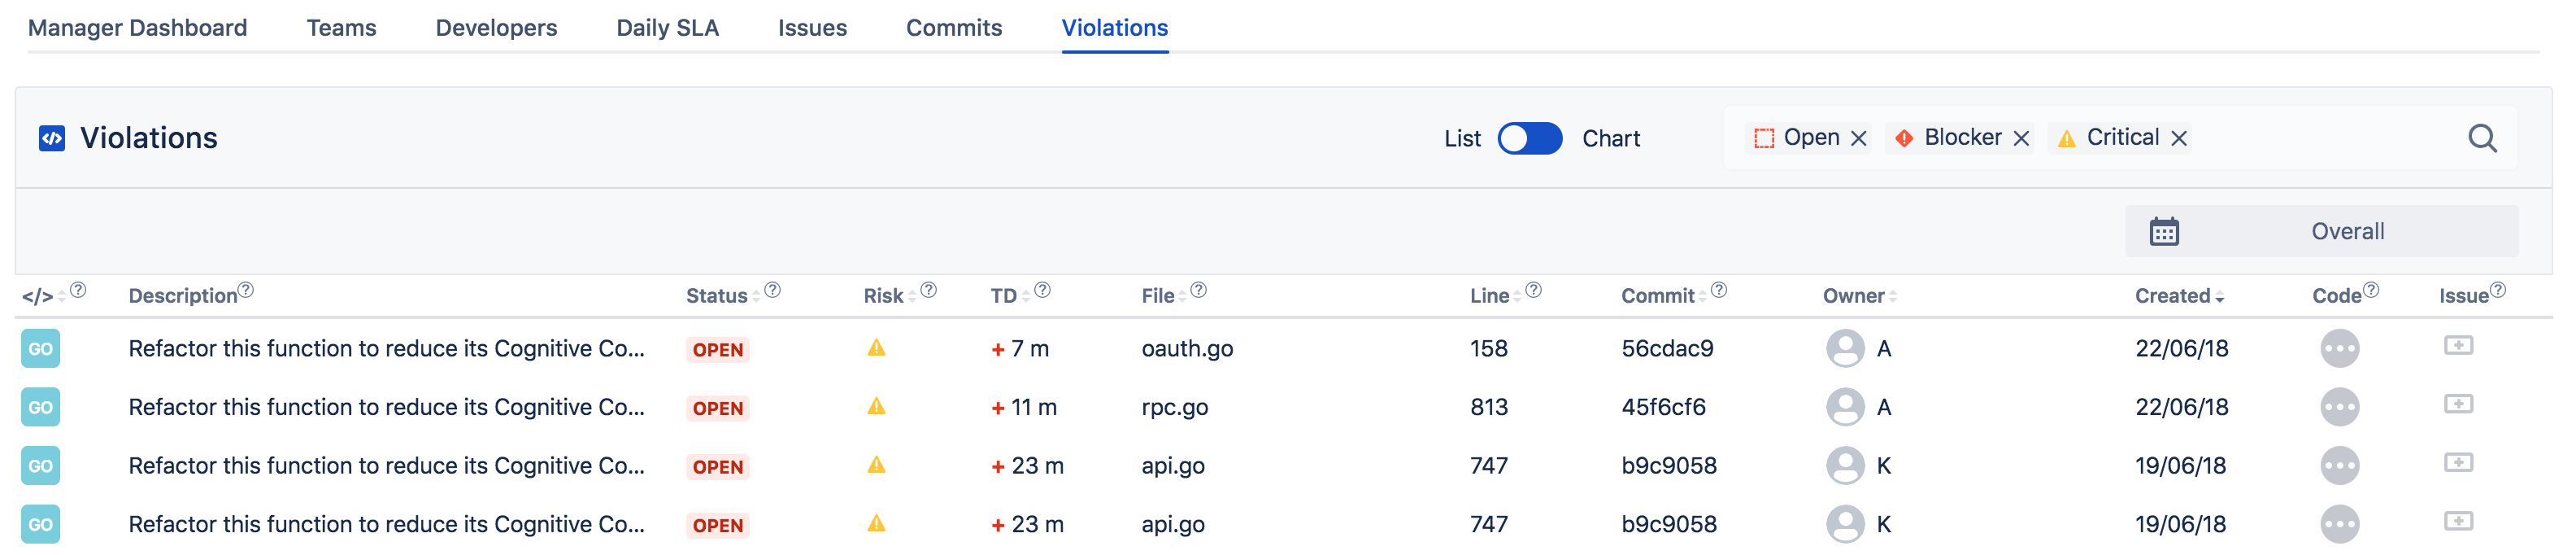
This way, critical issues are combined for all repositories inside the Violations tab:
3) SLA (Service Level Agreements)
I know you haven’t asked for this, but as we’re on the Project view already there’s one more feature, called SLA. It’s for setting threshold values for the project to:
- Set quality standards for projects within the organization.
- Be able to put SLA for code quality into a contract with your client to avoid ambiguities, like “best practices shall be used” or “high quality standard is expected”.
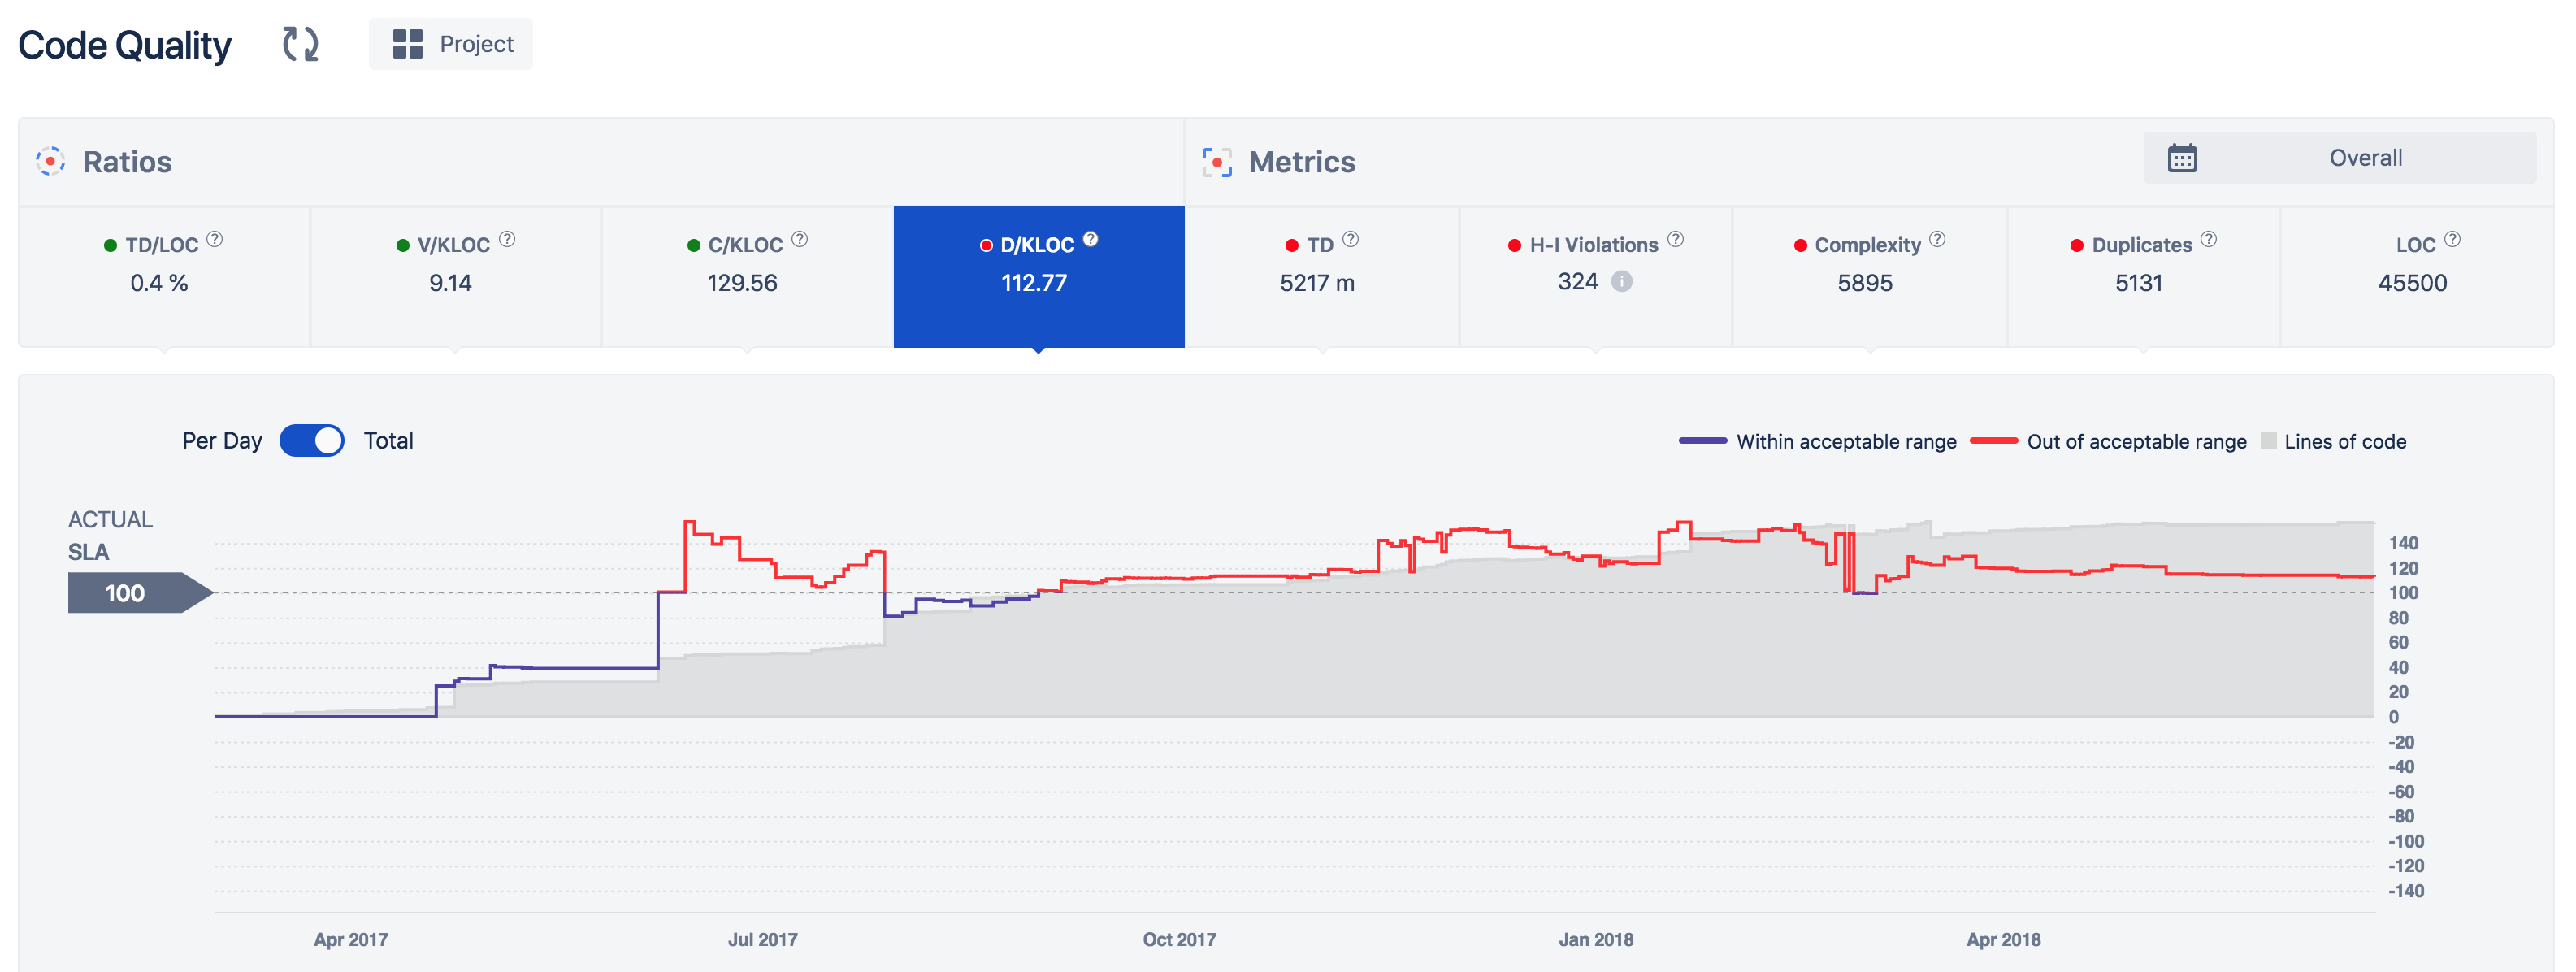
Pretty powerful feature from a business point of view. Here is how it looks like on the interface:
From this screen we see that:
- 3 of 8 metrics pass SLA requirements, while 5 or 8 fail them, at the current moment.
- Digging deeper into a specific metric we can get historical view on the metric to find out when the requirement was broken.
Arturs, thanks for reading that. Please let me know if your question answered or we should elaborate further?
P.S. Any issue, inconvenience, roadblock, question, anything! Please get here without hesitation, so we can help immediately.