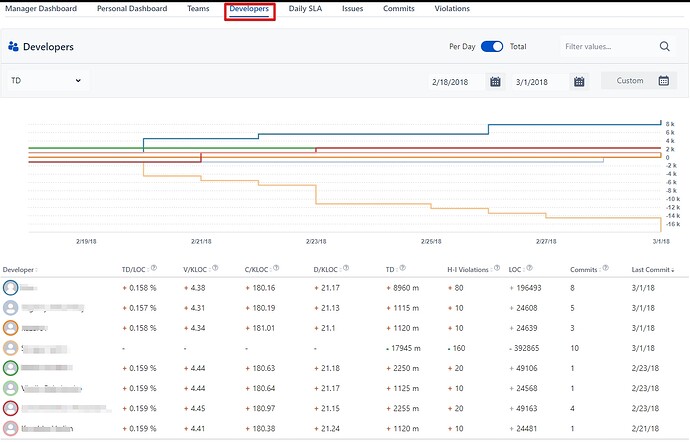
It is possible to compare developers in the “Developers” tab in the “Compare Developers” block. Developers can be filtered according to repository/project(s). Each developer`s progress is presented on the graph. It is possible to choose one of ratios or metrics. Total graph shows overall developer progress and Per Day graph shows data by commit days only. Graphs allow manager to see how many people commited code to repository for the chosen period. It allows to understand developers who really contribute to the project and those who are idle.
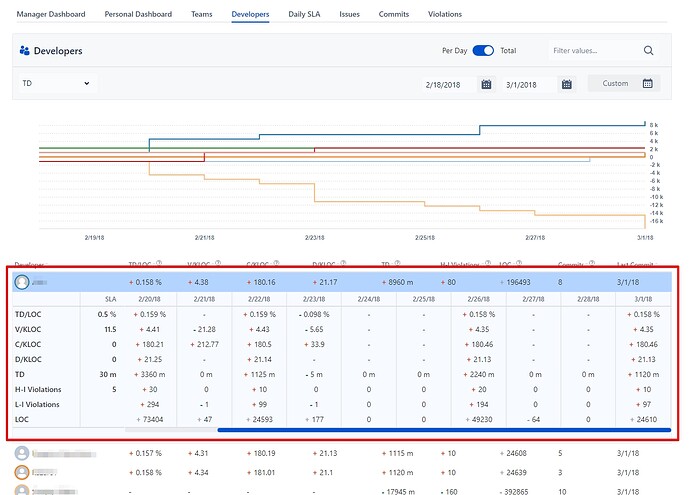
- Expanded developer details show all developer values per commit day.

