Manager Dashboard is a tool for a manager to control project condition, make predictions on a project progress, compare developers, sees Daily SLA Summary and High Impact Violations Summary.
Before user roles are enabled in the Settings->Permissions tab, all users of the system can see Manager Dashboard. After user roles are enabled, access to the functionality will be restricted for users that don’t have Manager role.
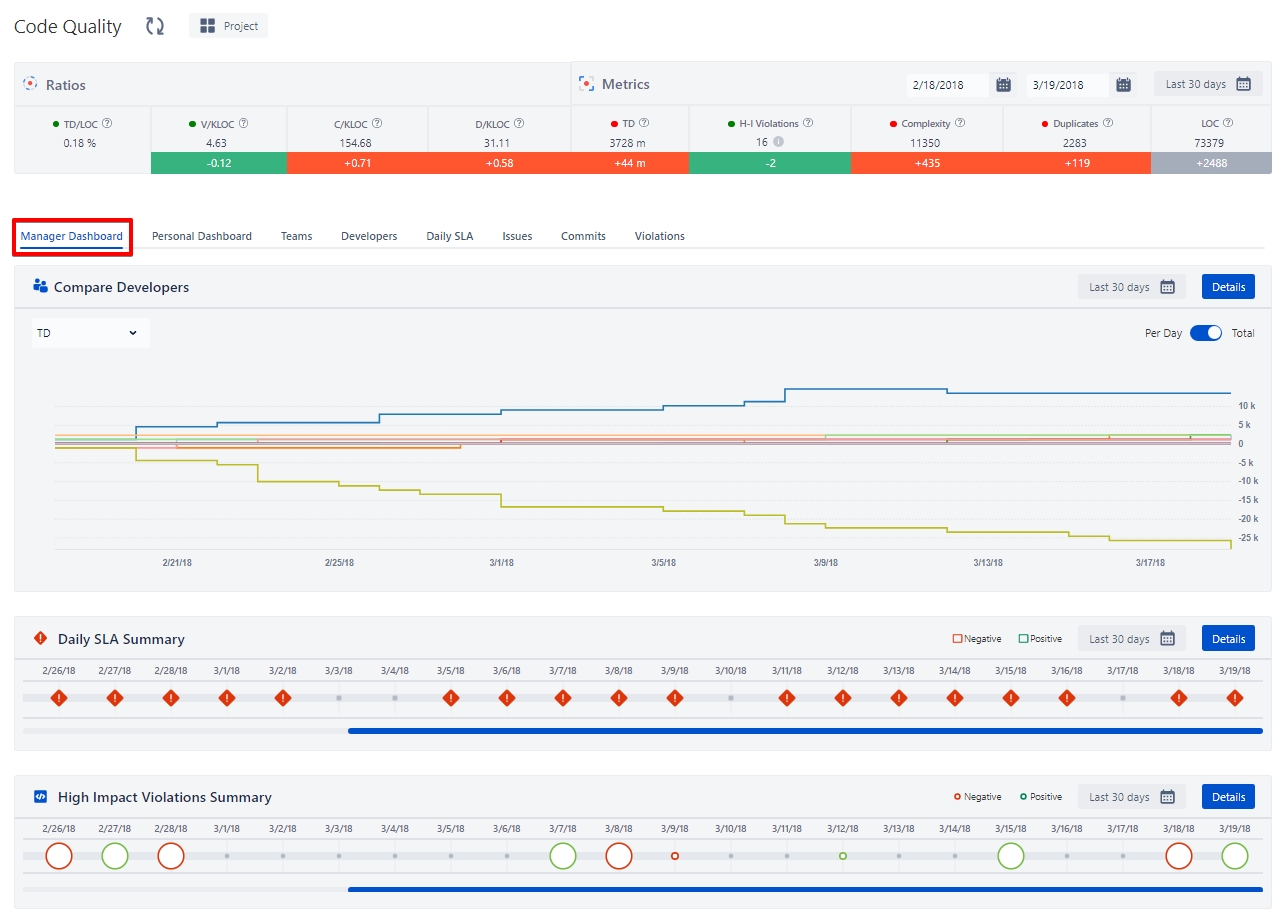
- Compare developers block
Contains graphs per developer for chosen ratio or metric. Total graph shows overall developer progress and per day graph shows data by commit days only. For more details click the “Details” button and you will be redirected to the “Developers” tab.
- Daily SLA Summary
Shows whether daily SLA values are met for every commit day. For more details click the “Details” button and you will be redirected to the “Daily SLA” tab.
- High Impact Violations Summary
Shows number of open/closed high impact violations per day. For more details click the “Details” button and you will be redirected to the “Violations” tab.